- Annual Report
- Overview
- Foreword from the Chairman of the Board of Directors and CEO
- 2025 strategy
- Market Switzerland
- Market Italy
- Other segments and activities
- Sustainability
- Corporate Governance
- Basic principles
- Group structure and shareholders
- Capital structure
- Board of Directors
- Executive Board of the Repower Group
- Shareholders' rights of participation
- Change of control and defensive measures
- Auditor
- Information policy
- Implementation of the ordinance against excessive compensation in listed stock companies
- Events after the balance sheet date
- Board of Directors
- Executive Board
- Compensation report
- Financial Report
- Consolidated financial statements of the Repower Group
- Comments on the consolidated financial statements
- Consolidated income statement
- Consolidated statement of comprehensive income
- Consolidated balance sheet
- Changes in consolidated shareholders equity
- Consolidated cash flow statement
- Notes
- 1 Total operating revenue
- 2 Personnel expenses
- 3 Depreciation/amortisation and impairment
- 4 Financial result
- 5 Income taxes
- 6 Result per share
- 7 Tangible assets
- 8 Intangible assets
- 9 Disclosures of interests in other entities
- 10 Other financial assets
- 11 Inventories
- 12 Receivables
- 13 Securities and other financial instruments
- 14 Positive/negative replacement values for held-for-trading positions
- 15 Cash and cash equivalents
- 16 Share capital
- 17 Non-current financial liabilities
- 18 Pension fund obligation
- 19 Other provisions
- 20 Other current liabilities
- 21 Current financial liabilities
- 22 Prepaid expenses and accrued income/deferred income and accrued expenses
- 23 Transactions with related parties
- 24 Additional disclosures on financial instruments
- Fair value hierarchy
- 25 Business combinations, disposals and liquidations
- 26 Assets and liabilities held for sale
- 27 Segment reporting
- 28 Contingent liabilities and warranty liabilities
- 29 Obligations under leasing arrangements
- 30 Events occurring after the balance sheet date
- Notes to the consolidated financial statements
- Consolidated accounting principles
- Summary of accounting and valuation principles
- Consolidation
- Accounting and valuation principles
- Capital and enterprise value management
- Risk management and financial risk management
- Estimation uncertainty
- Report of the auditors on the consolidated financial statements
- Financial statements of Repower AG
- Income statement
- Balance sheet
- Notes to the financial statements
- 1 Net sales
- 2 Depreciation/amortisation and impairment
- 3 Extraordinary, non-recurring or prior period income
- 4 Extraordinary, non-recurring or prior period expenses
- 5 Cash and cash equivalents and current assets with a stock exchange price
- 6 Trade receivables
- 7 Other receivables
- 8 Inventories and non-invoiced services
- 9 Financial assets
- 10 Intangible assets
- 11 Trade creditors
- 12 Short-term interest-bearing liabilities
- 13 Other current liabilities
- 14 Long-term interest-bearing liabilities
- 15 Other long-term liabilities
- 16 Provisions
- 17 Shareholders equity
- Share capital
- Treasury shares
- Other information
- Appropriation of retained earnings
- Report of the auditors on the financial statements
- Consolidated financial statements of the Repower Group
- Graphs
- Organisation Chart
- Archive
- Focus on the customers
Overview
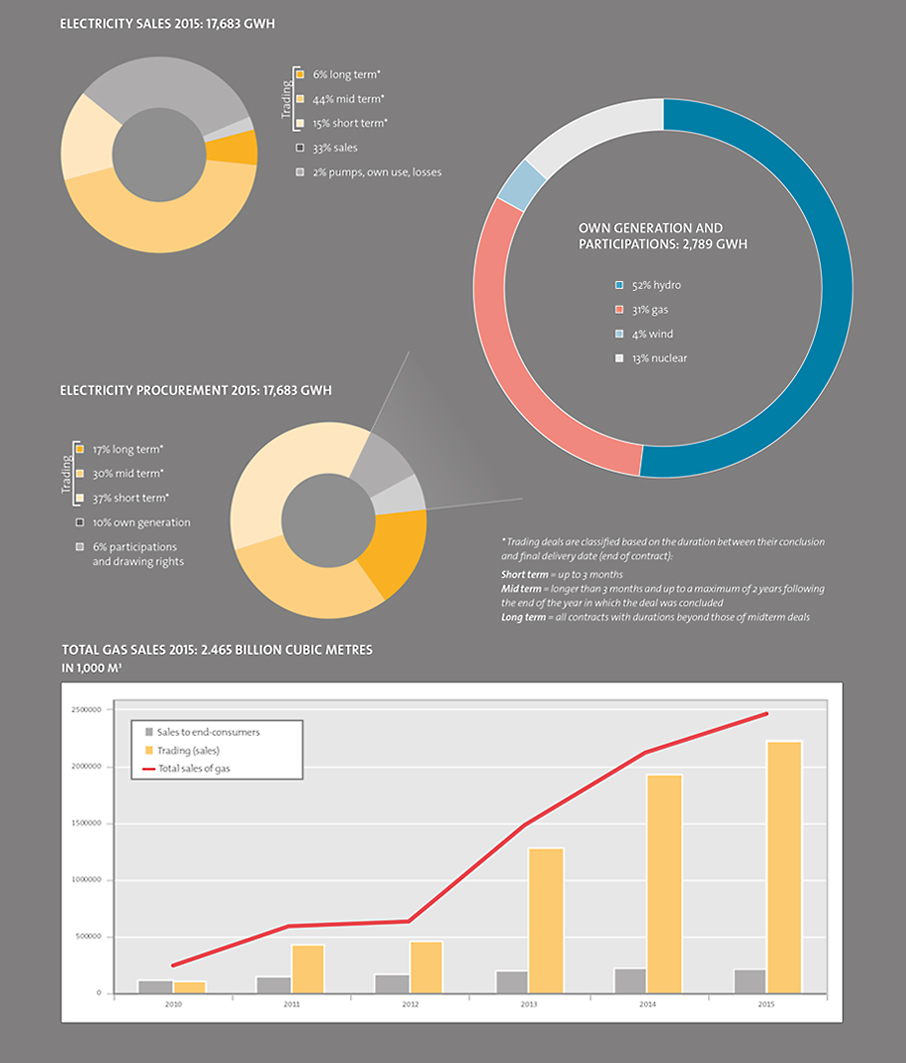
Energy balance sheet
| Electricity business in GWh | 2015 | 2014 | Change |
| Trading | 11,560 | 11,153 | +4% |
| Supply/sales | 5,782 | 5,945 | -3% |
| Pumps, own use, losses | 341 | 325 | +5% |
| Electricity sales | 17,683 | 17,423 | +1% |
| Trading | 14,894 | 14,770 | +1% |
| Own generation | 1,701 | 1,471 | +16% |
| Energy from participations | 1,088 | 1,182 | -8% |
| Electricity procurement | 17,683 | 17,423 | +1% |
| Gas business in 1,000 m3 | |||
| Sales to end customers | 235,599 | 222,580 | +6% |
| Trading (sales) | 919,752 | 710,906 | +29% |
| Held for trading | 1,309,715 | 1,187,975 | +10% |
| Gas sales | 2,465,066 | 2,121,461 | +16% |
| Consumption of Teverola gas-fired power plant (Italy) | 174,045 | 119,312 | +46% |
