- Annual Report
- Financial Report
- Consolidated Financial Statements of the Repower Group
- Comments on the consolidated financial statements
- Consolidated statements of comprehensive income
- Consolidated balance sheet
- Changes in consolidated equity
- Consolidated cash flow statement
- Note
- 1 Total operating revenue
- 2 Personnel expenses
- 3 Depreciation/amortisation and impairment
- 4 Financial income
- 5 Financial expenses
- 6 Investments in associates and partner plants
- 7 Income taxes
- 8 Earnings per share
- 9 Property, plant and equipment
- 10 Intangible assets
- 11 Other financial assets
- 12 Inventories
- 13 Receivables
- 14 Securities and other financial instruments
- 15 Positive/negative replacement values for held-for-trading positions
- 16 Cash and cash equivalents
- 17 Share capital
- 18 Non-current financial liabilities
- 19 Pension fund obligation
- 20 Provisions
- 21 Other non-current liabilities
- 22 Other current liabilities
- 23 Current financial liabilities
- 24 Prepaid expenses, accruals and deferred income
- 25 Transactions with related parties
- 26 Additional disclosures on financial instruments
- 27 Business combinations and disposals
- 28 Assets and liabilities held for sale
- 29 Impairment of assets
- 30 Correction to prior-year figures
- 31 Segment reporting - Group-wide information
- 32 Contingent liabilities and guarantee obligations
- 33 Obligations related to operating leases
- 34 Risk assessment
- 35 Events occurring after the balance sheet date
- Notes to the consolidated financial statements
- Report of the Group auditors
- Financial Statements of Repower AG
- Income statement
- Balance sheet
- Notes
- 1 Depreciation and amortisation
- 2 Intangible assets
- 3 Financial assets
- 4 Receivables
- 5 Prepaid expenses and accrued income
- 6 Equity
- 7 Provisions
- 8 Non-current liabilities
- 9 Current liabilities
- Other information
- Disclosures in accordance with Art. 663bbis of the Swiss Code of Obligations
- Disclosures in accordance with Art. 663c of the Code of Obligations at 31 December of the financial year
- Appropriation of retained earnings
- Report of the auditors
- Consolidated Financial Statements of the Repower Group
- Graphics
- Organisation chart
- Download
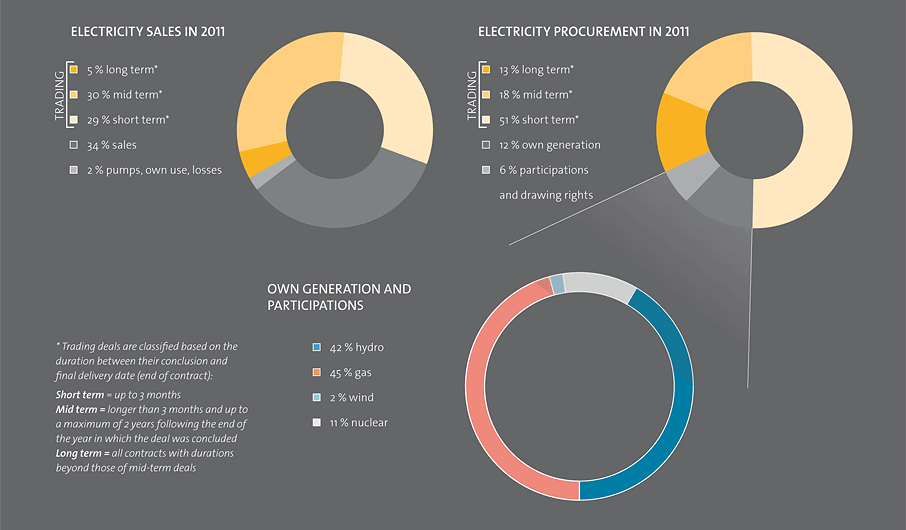
Energy balance sheet
| Energy balance sheet | |||
| 2010 | 2011 | Change | |
| Electricity business in GWh | |||
| Trading | 14,563 | 12,039 | - 17 % |
| Supply/sales | 4,603 | 6,415 | + 39 % |
| Pumps, own use, losses | 520 | 410 | - 21 % |
| Electricity sales | 19, 686 | 18,864 | - 4 % |
| Trading | 16,959 | 15,532 | - 8 % |
| Own generation | 1,788 | 2,243 | + 25 % |
| Energy from participations | 940 | 1,089 | + 16 % |
| Electricity procurement | 19,686 | 18,864 | - 4 % |
| Gas business in 1,000 m3 | |||
| Sales to end customers | 125,230 | 153,654 | + 23 % |
| Trading (sales) | 110,371 | 437,694 | + 297 % |
| Gas sales | 235,601 | 591,348 | + 151 % |
| Consumption gas-fired power plant Teverola (Italy) | 210,274 | 290,615 | + 38 % |
