- Annual Report
- Overview
- Foreword from the Chairman of the Board of Directors and CEO
- Market Switzerland
- Market Italy
- Other segments and activities
- Sustainability
- Corporate governance
- Basic principles
- Group structure and shareholders
- Board of Directors
- Executive Board of the Repower Group
- Shareholders' rights of participation
- Change of control and defensive measures
- Auditor
- Information policy
- Implementation of the Ordinance against Excessive Compensation in Listed Stock Companies
- Events after the balance sheet date
- Board of Directors
- Executive Board
- Compensation Report
- Financial Report
- Consolidated Financial Statements of the Repower Group
- Comments on the consolidated financial statements
- Consolidated income statement
- Consolidated statement of comprehensive income
- Consolidated balance sheet
- Changes in consolidated shareholders equity
- Consolidated cash flow statement
- Notes
- 1 Total operating revenue
- 2 Personnel expenses
- 3 Depreciation/amortisation and impairment
- 4 Financial result
- 5 Income taxes
- 6 Result per share
- 7 Tangible assets
- 8 Intangible assets
- 9 Disclosures of interests in other entities (IFRS 12)
- 10 Other financial assets
- 11 Inventories
- 12 Receivables
- 13 Securities and other financial instruments
- 14 Positive/negative replacement values for held-for-trading positions
- 15 Cash and cash equivalents
- 16 Share capital
- 17 Non-current financial liabilities
- 18 Pension fund obligation
- 19 Other provisions
- 20 Other current liabilities
- 21 Current financial liabilities
- 22 Information about net current assets for the cash flow statement
- 23 Transactions with related parties
- 24 Additional disclosures on financial instruments
- 25 Business combinations, disposals and liquidations
- 26 Assets and liabilities held for sale
- 27 Segment reporting
- 28 Contingent liabilities and warranty liabilities
- 29 Obligations under leasing arrangements
- 30 Risk assessment
- 31 Events occurring after the balance sheet date
- Notes to the consolidated financial statements
- Consolidated accounting principles
- Summary of accounting and valuation principles
- Consolidation
- Accounting and valuation principles
- Capital and enterprise value management
- Risk management and financial risk management
- Estimation uncertainty
- Report of the Auditors on the consolidated financial statements
- Financial Statements of Repower AG
- Consolidated Financial Statements of the Repower Group
- Graphics
- Organisation Chart
- Archive
- Hydropower
Overview
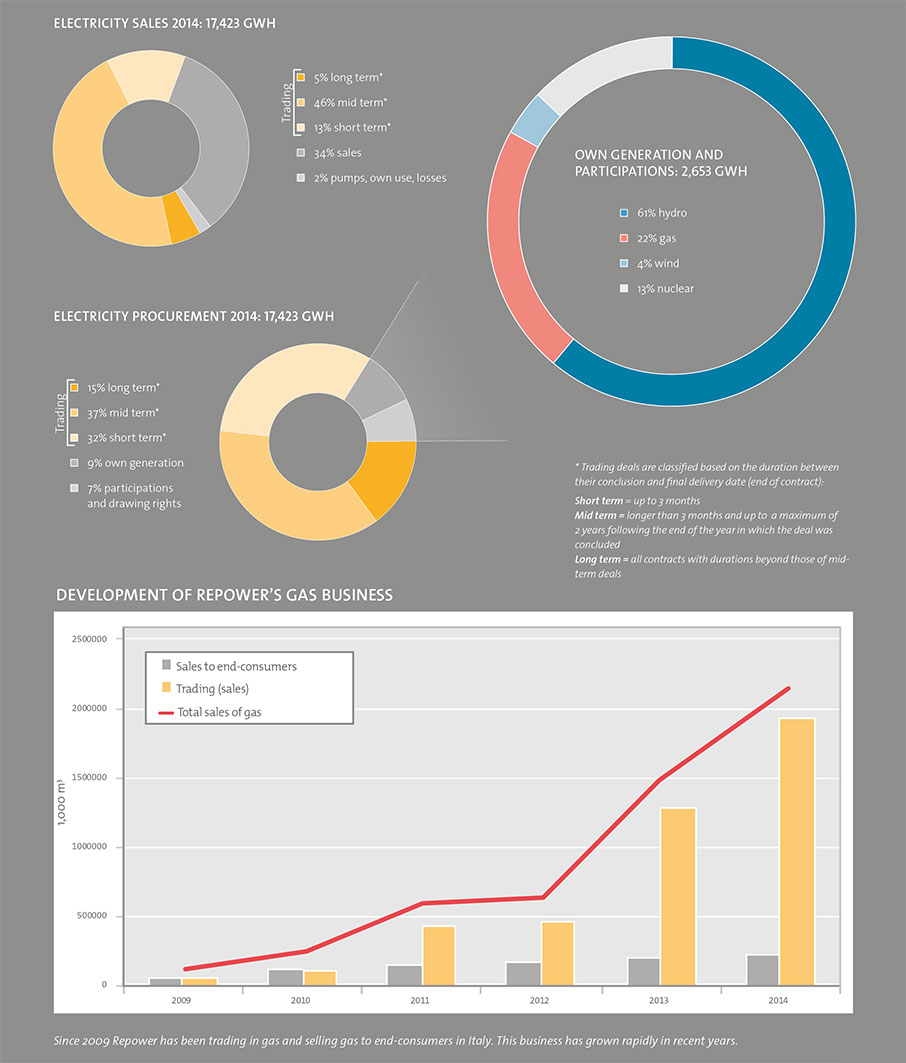
Energy balance sheet
| 2014 | 2013 | Change | |
| Electricity business in GWh | |||
| Trading | 11,153 | 10,751 | + 4 % |
| Supply/sales | 5,945 | 5,908 | + 1 % |
| Pumps, own use, losses | 325 | 353 | - 8 % |
| Electricity sales | 17,423 | 17,012 | + 2 % |
| Trading | 14,770 | 14,698 | 0 % |
| Own generation | 1,471 | 1,371 | + 7 % |
| Energy from participations | 1,182 | 943 | + 25 % |
| Electricity procurement | 17,423 | 17,012 | + 2 % |
| Gas business in 1,000 m3 | |||
| Sales to end customers | 222,580 | 208,624 | + 7 % |
| Trading (sales) | 1,898,881 | 1,291,990 | + 47 % |
| Gas sales | 2,121,461 | 1,500,614 | + 41 % |
| Consumption of Teverola gas-fired power plant (Italy) | 119,312 | 106,483 | + 12 % |
