- Annual Report
- Financial Report
- Consolidated Financial Statements of the Repower Group
- Comments on the consolidated financial statements of the Repower Group
- Consolidated statement of comprehensive income
- Consolidated balance sheet
- Changes in consolidated equity
- Consolidated cash flow statement
- Notes
- 1 Total operating revenue
- 2 Personnel expenses
- 3 Depreciation/amortisation and impairment
- 4 Financial income
- 5 Financial expenses
- 6 Investments in associates and partner plants
- 7 Income taxes
- 8 Earnings per share
- 9 Property, plant and equipment
- 10 Intangible assets
- 11 Other financial assets
- 12 Inventories
- 13 Receivables
- 14 Securities and other financial instruments
- 15 Positive/negative replacement values for held-for-trading positions
- 16 Cash and cash equivalents
- 17 Share capital
- 18 Non-current financial liabilities
- 19 Pension fund obligation
- 20 Provisions
- 21 Other non-current liabilities
- 22 Other current liabilities
- 23 Current financial liabilities
- 24 Information about net current assets
- 25 Transactions with related parties
- 26 Additional disclosures on financial instruments
- 27 Business combinations and disposals
- 28 Assets and liabilities held for sale
- 29 Impairment of assets
- 30 Segment reporting Group-wide information
- 31 Contingent liabilities and guarantee obligations
- 32 Obligations under leasing arrangements
- 33 Risk assessment
- 34 Events occurring after the balance sheet date
- Notes to the consolidated financial statements
- Report of the Auditors to the consolidated financial statements
- Financial Statements of Repower AG
- Appropriation of retained earnings
- Report of the Auditors
- Consolidated Financial Statements of the Repower Group
- Graphics
- Organisation chart
- Download
- Biomimetics
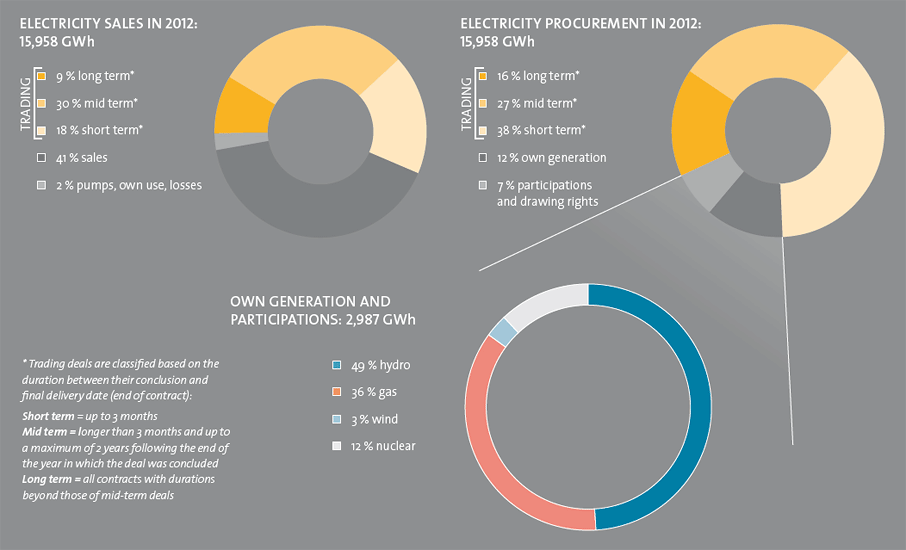
Energy balance sheet
Energy balance sheet
| 2011 | 2012 | Change | |
| Electricity business in GWh | |||
| Trading | 12,039 | 9,049 | - 25 % |
| Supply/sales | 6,415 | 6,516 | + 2 % |
| Pumps, own use, losses | 410 | 393 | - 4 % |
| Electricity sales | 18,864 | 15,958 | - 15 % |
| Trading | 15,532 | 12,970 | - 16 % |
| Own generation | 2,243 | 1,890 | - 16 % |
| Energy from participations | 1,089 | 1,098 | + 1 % |
| Electricity procurement | 18,864 | 15,958 | - 15 % |
| Gas business in 1,000 m3 | |||
| Sales to end customers | 153,654 | 171,271 | + 12 % |
| Trading (sales) | 437,694 | 468,512 | + 7 % |
| Gas sales | 591,348 | 639,783 | + 8 % |
| Consumption of Teverola gas-fired power plant (Italy) | 290,615 | 206,821 | - 29 % |

