- Semi-annual report
- Financial report
- Interim consolidated financial statements
- Notes to the interim consolidated financial statements
- Company information
- Principles of consolidation
- Changes in consolidation
- Asset impairment and impairment reversals
- Cash and cash equivalents
- Change in net current assets
- Additional information on financial instruments and items measured at fair value
- Assets and liabilities held for sale
- Other disclosures
- Contingent liabilities and guarantee obligations
- Estimation uncertainties
- Events occurring after the balance sheet date
- Graphics
- Archive
Energy balance sheet
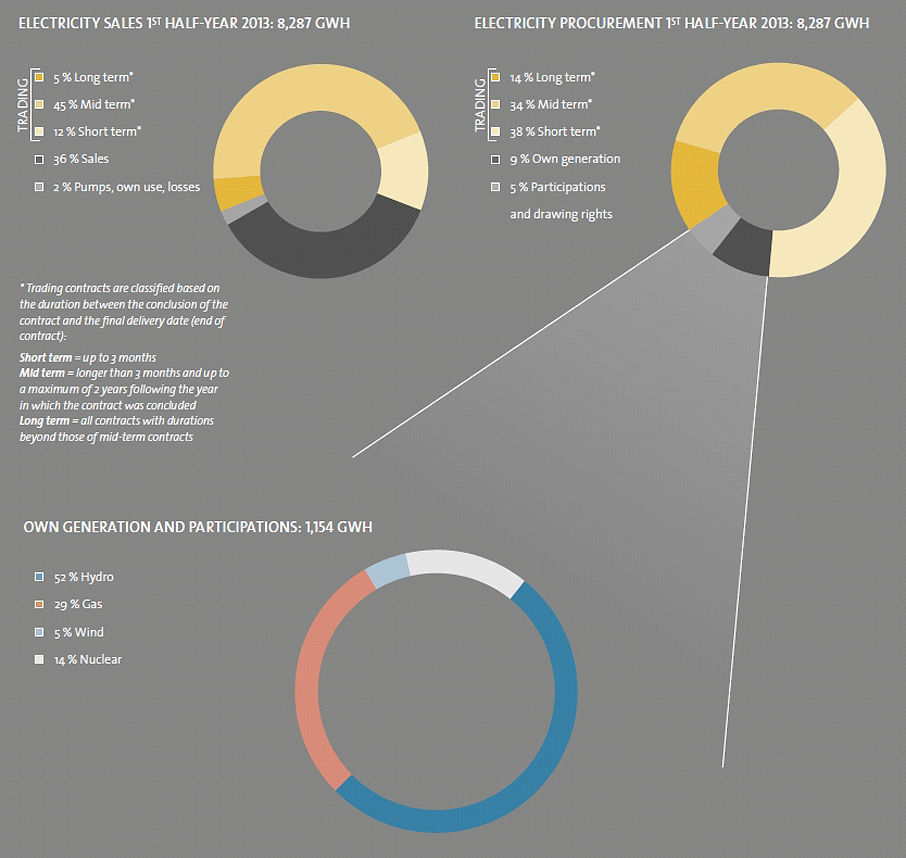
ENERGY BALANCE SHEET
| 1st half-year 2012 | 1st half-year 2013 | Change | |
| Electricity business in GWh | |||
| Trading | 4,066 | 5,114 | + 26 % |
| Supply/sales | 3,359 | 2,999 | - 11 % |
| Pumps, own use, losses | 192 | 174 | - 9 % |
| Electricity sales | 7,617 | 8,287 | + 9 % |
| Trading | 6,314 | 7,133 | + 13 % |
| Own generation | 845 | 712 | - 16 % |
| Energy from participations | 458 | 442 | - 3 % |
| Electricity procurement | 7,617 | 8,287 | + 9 % |
| Gas business in 1,000 m3 | |||
| Sales to end customers | 93,760 | 123,320 | + 32 % |
| Trading (sales) | 233,337 | 419,718 | + 80 % |
| Gas sales | 327,097 | 543,038 | + 66 % |
| Teverola power plant (Italy) consumption | 93,627 | 58,754 | - 37 % |
