| |
|
|
|
| Energy balance sheet |
|
|
|
| |
1st half-year 2011 |
1st half-year 2012 |
Change |
| Electricity business in GWh |
|
|
|
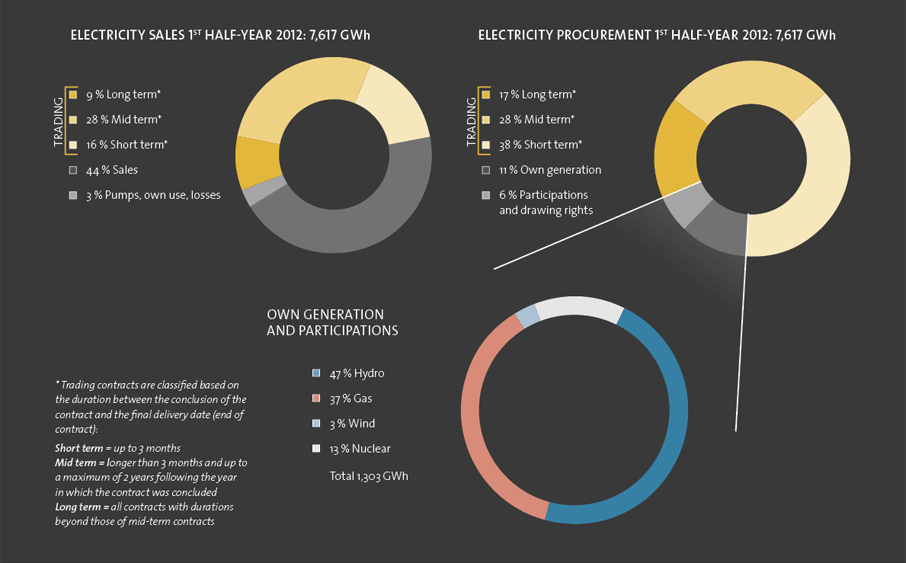
| Trading |
6,494 |
4,066 |
- 37 % |
| Supply/sales |
3,180 |
3,359 |
+ 6 % |
| Pumps, own use, losses |
179 |
192 |
+ 7 % |
| Electricity sales |
9,853 |
7,617 |
- 23 % |
| Trading |
8,377 |
6,314 |
- 25 % |
| Own generation |
948 |
845 |
- 11 % |
| Energy from participations |
524 |
458 |
- 13 % |
| Miscellaneous |
4 |
- |
- |
| Electricity procurement |
9,853 |
7,617 |
- 23 % |
| |
|
|
|
| Gas business in 1,000 m3 |
|
|
|
| Sales to end customers |
81,541 |
93,760 |
+ 15 % |
| Trading (sales) |
179,307 |
233,337 |
+ 30 % |
| Gas sales |
260,848 |
327,097 |
+ 25 % |
| Teverola power plant (Italy) consumption |
128,156 |
93,627 |
- 27 % |
