Overview
Overview of the first half of 2017
CHF million
Total operating revenue 1st half-year 2017CHF million
Operating income (EBIT) 1st half-year 2017The most important events of the first half of 2017
- In the first half of 2017, Repower Group generated total operating revenues of CHF 905 million (up 3% on the first half of 2016).
- Operating income (EBIT) was CHF 20 million, 55 per cent lower than in the prior-year period. The business in Italy made a particularly notable contribution to these results. The group posted a net profit of CHF 1 million.
- The first half of 2017 was dominated by successful efforts to continue implementing the companyʼs strategy. This included expanding the sales and service component of the business by increasingly delivering contracts for third parties and services for large customers and trading partners.
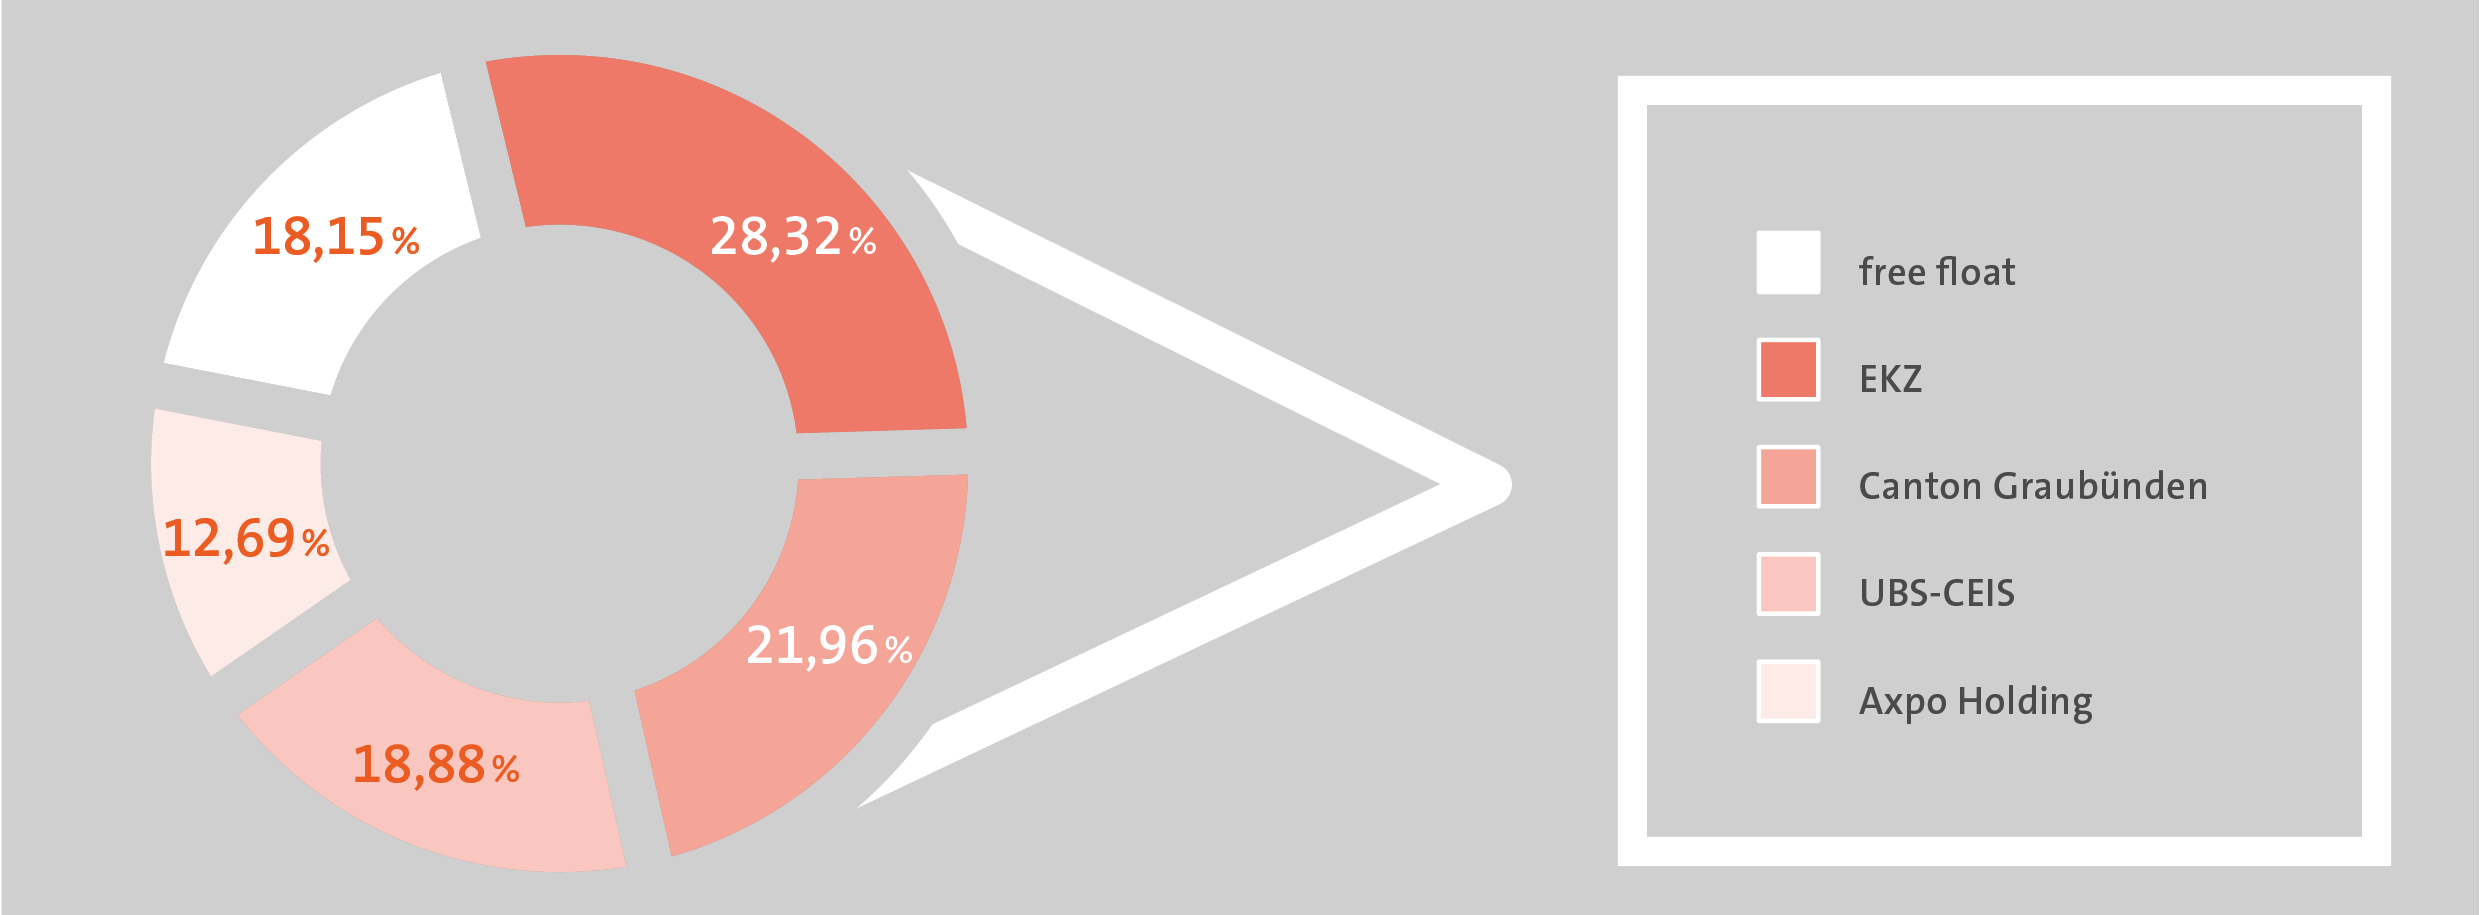
- An important new partner, Elektrizitätswerke des Kantons Zürich (EKZ), joined the production investment company Repartner Produktions AG. EKZ holds a 6 per cent interest.
- To maintain the high quality of services to end-consumers, Repower bundled its basic supply and grid use business in a single organisational unit.
Financial highlights
|
|
1st half-year 2017 |
1st half-year 2016 |
1st half-year 2015 |
1st half-year 2014 |
|
CHF million |
|
|
|
|
|
Revenue and income |
|
|
|
|
|
Total operating revenue |
905 |
881 |
922 |
1,196 |
|
Income before interest, taxes, depreciation and amortisation (EBITDA) |
43 |
51 |
29 |
57 |
|
Depreciation/amortisation, impairment and reversal of impairment |
–22 |
–5 |
–63 |
–25 |
|
Income before interest and taxes (EBIT) |
20 |
45 |
–34 |
32 |
|
Group result |
1 |
18 |
–108 |
4 |
|
|
|
|
|
|
|
Balance sheet |
|
|
|
|
|
Balance sheet total at 30 June |
1,681 |
1,792 |
1,780 |
2,014 |
|
Equity at 30 June |
794 |
620 |
631 |
793 |
|
Equity ratio |
47% |
35% |
35% |
39% |
|
|
|
|
|
|
|
Further key figures |
|
|
|
|
|
Energy gross margin |
109 |
113 |
93 |
125 |
|
Economic value added |
–8 |
8 |
–60 |
–15 |
|
Operating cash flow |
19 |
44 |
11 |
46 |
|
Net debt |
–11 |
233 |
253 |
308 |
|
Debt factor |
-0,1 |
2,4 |
4 |
2,6 |
|
FFO / Net debt |
–313% |
23,0% |
7,3% |
17,8% |
|
CAPEX* |
11 |
9 |
9 |
11 |
|
Headcount (FTE) |
569 |
627 |
671 |
700 |
* Includes investments in tangible assets, intangible assets and associates, and loans for investment purposes
Stock statistics
|
Share capital |
7,390,968 |
registered shares |
at CHF |
1,00 |
CHF 7,4 million |
|
|
|
|
|
|
|
|
Prices (CHF) 1 |
|
1st half-year 2017 |
1st half-year 2017 2 |
||
|
Registered share |
|
|
High |
63 |
48 |
|
|
|
|
Low |
55 |
40 |
1 Source: OTC-X, Berner Kantonalbank
2 Information is for the period from 24 May to 30 June 2016, in other words from the date the registered shares were introduced until the end of the half-year period.
|
Dividend (CHF) |
2016 |
2015 |
2014 |
2013 |
|
|
|
|
|
|
|
Registered share |
0,00 |
0,00 |
0,00 |
2,00 |
Repowerʼs shareholder structure

Headcount
|
at 30 June |
2017 |
2016 |
|
|
|
|
|
Switzerland |
428 |
439 |
|
Italy |
161 |
155 |
|
Romania |
- |
31 |
|
Czech Republic |
- |
2 |
|
Total |
589 |
627 |
|
|
|
|
|
Trainees |
30 |
30 |
|
Sales consultants Italy |
606 |
583 |