Overview
Overview of the year 2019
billion francs
million francs
operating income (EBIT)Merchant line
Voters say Yes to modifying Valposchiavo concession
Construction begins at Mendrisio substation
Security of supply boosted in Graubünden
Repower strengthens partnerships
Uncertainty in Italy
Italy showcases electrical innovation
Wind power boosted
FINANCIAL HIGHLIGHTS
|
|
2019 |
2018 |
2017 |
2016 |
2015 |
|
|
Swiss GAAP FER |
Swiss GAAP FER |
Swiss GAAP FER |
Swiss GAAP FER |
IFRS |
|
CHF million |
|
|
|
|
|
|
|
|
|
|
|
|
|
Revenue and income |
|
|
|
|
|
|
Total operating revenue |
1,937 |
2,090 |
1,847 |
1,724 |
1,890 |
|
Earnings before interest, taxes, depreciation and amortisation (EBITDA) |
117 |
82 |
79 |
52 |
41 |
|
Depreciation/amortisation and value adjustments |
–52 |
–47 |
–45 |
–30 |
–109 |
|
Earnings before interest and taxes (EBIT) |
65 |
35 |
34 |
22 |
–69 |
|
Group earnings |
50 |
16 |
20 |
–1 |
–136 |
|
|
|
|
|
|
|
|
Balance sheet |
|
|
|
|
|
|
Balance sheet total at 31 December |
1,876 |
1,873 |
1,822 |
1,701 |
1,828 |
|
Equity at 31 December |
844 |
807 |
769 |
737 |
600 |
|
Equity ratio |
45% |
43% |
42% |
43% |
33% |
|
|
|
|
|
|
|
|
Further key figures |
|
|
|
|
|
|
Energy gross margin |
264 |
223 |
208 |
194 |
178 |
|
Economic value added |
–1 |
–20 |
–18 |
–29 |
–112 |
|
Funds from Operations (FFO) |
103 |
60 |
72 |
30 |
11 |
|
Cash flow from operating activities |
126 |
55 |
43 |
78 |
17 |
|
Net debt |
–29 |
45 |
–2 |
–9 |
270 |
|
Net debt factor |
–0.3 |
0,5 |
0.0 |
-0,1 |
4,5 |
|
FFO/net debt |
<0% |
134% |
< 0% |
<0% |
4,1% |
|
Investments |
41 |
35 |
32 |
33 |
31 |
|
Headcount (FTE) |
539 |
591 |
578 |
563 |
632 |
ENERGY BALANCE SHEET
|
|
2019 |
2018 |
Change |
|
|
|
|
|
|
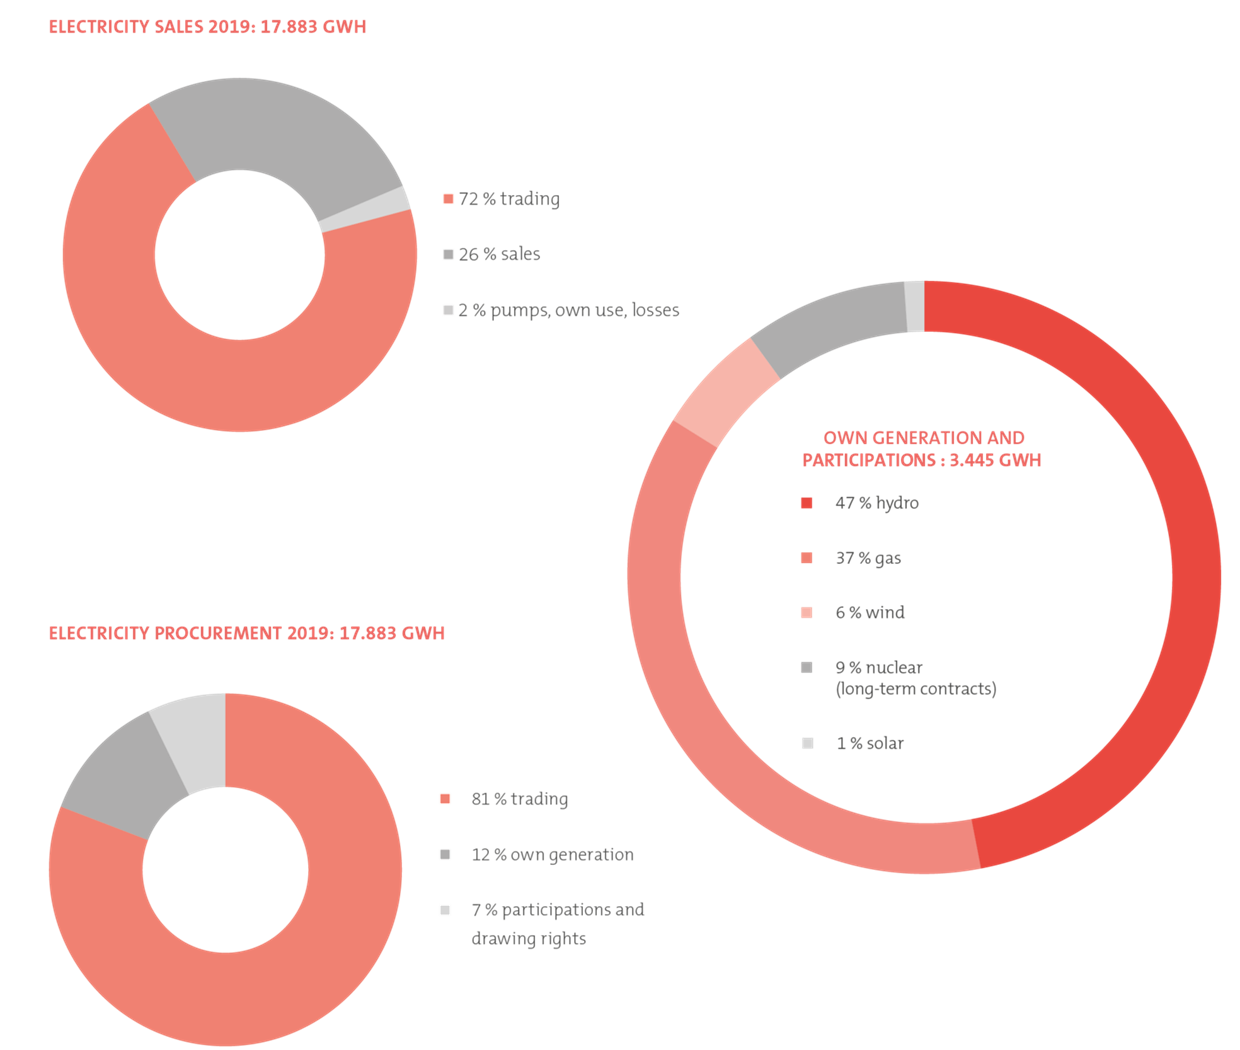
Electricity business in GWh |
|
|
|
|
Trading |
12,979 |
12,519 |
4% |
|
Supply/sales |
4,577 |
4,473 |
2% |
|
Pumps, own use, losses |
326 |
318 |
3% |
|
Electricity sales |
17,883 |
17,310 |
3% |
|
|
|
|
|
|
Trading |
14,437 |
14,362 |
1% |
|
Own generation |
2,226 |
1,662 |
34% |
|
Energy from participations |
1,219 |
1,286 |
–5% |
|
Electricity procurement |
17,883 |
17,310 |
3% |
|
|
|
|
|
|
Gas business in 1,000 m3 |
|
|
|
|
Sales to end customers |
324,073 |
349,736 |
–7% |
|
Trading (sales) |
3,201,280 |
1,098,572 |
191% |
|
Gas sales |
3,525,353 |
1,448,309 |
143% |
|
Consumption of Teverola gas-fired power plant (Italy) |
250,681 |
178,461 |
40% |
STOCK STATISTICS
|
Share capital |
7,390,968 |
registered shares |
@ CHF |
1.00 |
CHF 7.4 million |
|
|
|
|
|
|
|
|
|
|
|
|
2019 |
2018 |
|
Prices (CHF) on OTC-X, Berner Kantonalbank |
|
|
|
|
|
|
Registered share |
|
|
High |
104 |
80 |
|
|
|
|
Low |
72 |
66 |
|
Dividends (CHF) |
2019 1) |
2018 |
2017 |
2016 |
|
|
|
|
|
|
|
Registered share |
2.50 |
0.50 |
0.00 |
- |
1) The 2019 dividend is subject to the decision of the annual general meeting. There are no restrictions or limitations on voting rights.
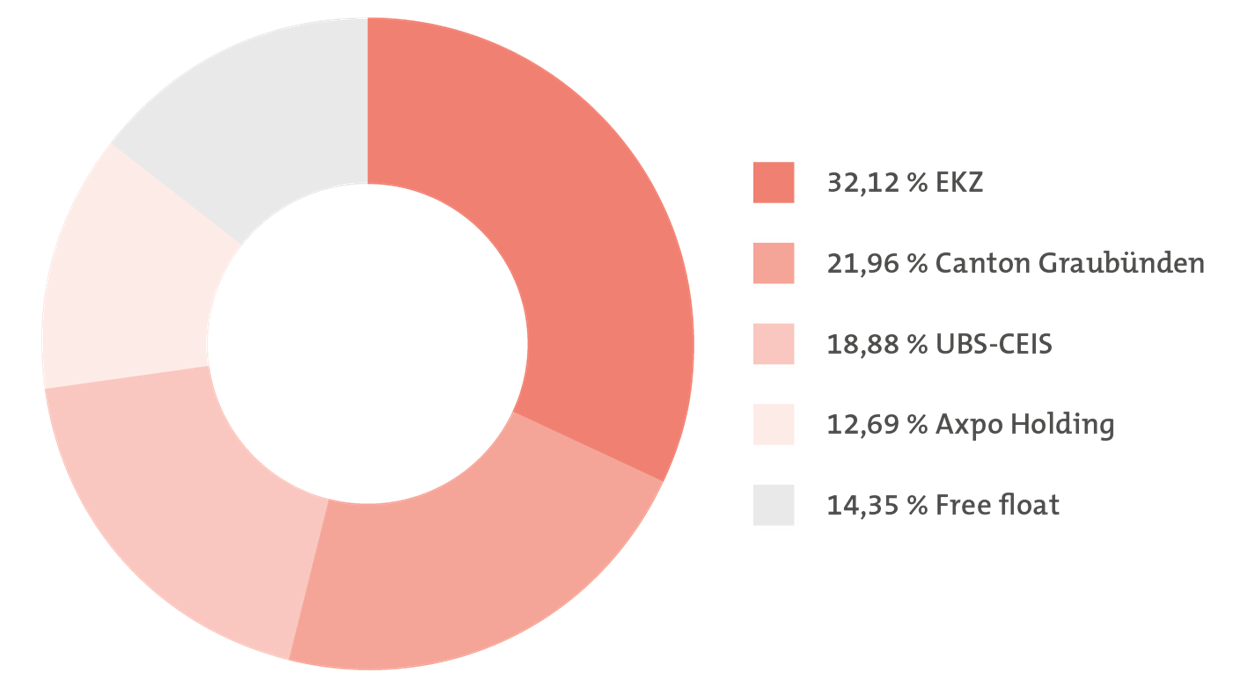
REPOWER’S SHAREHOLDER STRUCTURE at close of accounts on 31 december
HEADCOUNT
|
at 31 December |
2019 |
2018 |
|
|
|
|
|
Total 1) |
555 |
610 |
|
Switzerland |
388 |
442 |
|
Italy |
167 |
168 |
|
|
|
|
|
Trainees |
30 |
30 |
|
Sales consultants Italy |
510 |
599 |
1) For the numbers in full-time equivalents (FTEs) see "Financial highlights" table. Since October 2019 the employees of the former SWIBI AG are no longer been recognised.