Overview
OVERVIEW OF THE FIRST HALF OF 2018
CHF billion
Total operating revenue 1st half-year 2018CHF million
Operating income (EBIT) 1st half-year 2018The most important events of the first half of 2018
- In the first half of 2018 Repower Group generated total operating revenue of CHF 1,053 million (up 16% on the first half of 2017).
- Operating income (EBIT) was CHF 9 million. Earnings came in at practically the same level as in the prior-year period.
- The Market Switzerland and Market Italy segments both posted positive operating earnings.
- The organisational realignment has enabled Repower to continue execution of its strategy according to plan. In the first six months Repower scored successes in its core business, in contracts for third parties, and in new services.
- The annual general meeting held on 16 May 2018 elected Dr Monika Krüsi as the new chair of the board of directors.
- The company also made good progress in electric transportation in both Switzerland and in Italy. Many new partnerships are facilitating the expansion of the public PLUG’N ROLL network in Switzerland, and the introduction of a highly advanced remote control system for electric vehicle charging stations – a revolution in this sector – is creating a stir in Italy.
FINANCIAL HIGHLIGHTS
|
|
1st half-year 2018 |
1st half-year 2017 |
1st half-year 2016 |
1st half-year 2015 |
1st half-year 2014 |
|
|
Swiss GAAP FER |
Swiss GAAP FER |
IFRS |
IFRS |
IFRS |
|
CHF million |
|
|
|
|
|
|
|
|
|
|
|
|
|
Revenue and income |
|
|
|
|
|
|
Total operating revenue |
1,053 |
905 |
881 |
922 |
1,196 |
|
Income before interest, taxes, depreciation and amortisation (EBITDA) |
32 |
42 |
51 |
29 |
57 |
|
Depreciation and value adjustments |
–23 |
–22 |
–5 |
–63 |
–25 |
|
Income before interest and taxes (EBIT) |
9 |
20 |
45 |
–34 |
32 |
|
Group result |
0 |
1 |
18 |
–108 |
4 |
|
|
|
|
|
|
|
|
Balance sheet |
|
|
|
|
|
|
Balance sheet total at 30 June |
1,771 |
1,822 |
1,792 |
1,780 |
2,014 |
|
Equity at 30 June |
768 |
769 |
620 |
631 |
793 |
|
Equity ratio |
43% |
42% |
35% |
35% |
39% |
|
|
|
|
|
|
|
|
Further key figures |
|
|
|
|
|
|
Energy gross margin |
104 |
109 |
113 |
93 |
125 |
|
Economic value added |
–15 |
–6 |
8 |
–60 |
–15 |
|
Operating cash flow |
15 |
22 |
44 |
11 |
46 |
|
Net debt |
–38 |
–37 |
233 |
253 |
308 |
|
Debt factor |
–0.6 |
–0.4 |
2,4 |
4 |
2,6 |
|
FFO / Net debt |
< 0% |
< 0% |
23,0% |
7,3% |
17,8% |
|
CAPEX* |
12 |
11 |
9 |
9 |
11 |
|
Headcount (FTE) |
575 |
569 |
627 |
671 |
700 |
* Includes investments in tangible assets, intangible assets and associates, and loans for investment purposes
STOCK STATISTICS
|
Share capital |
7,390,968 |
registered shares |
at CHF |
1.00 |
CHF 7.4 million |
|
|
|
|
|
|
|
|
Prices (CHF) 1 |
|
1st half-year 2018 |
1st half-year 2017 |
||
|
Registered share |
|
|
High |
73 |
63 |
|
|
|
|
Low |
66 |
55 |
1 Source: OTC-X, Berner Kantonalbank
|
Dividend (CHF) |
2017 |
2016 |
2015 |
2014 |
2013 |
|
|
|
|
|
|
|
|
Registered share |
0.00 |
0.00 |
0.00 |
0.00 |
2.00 |
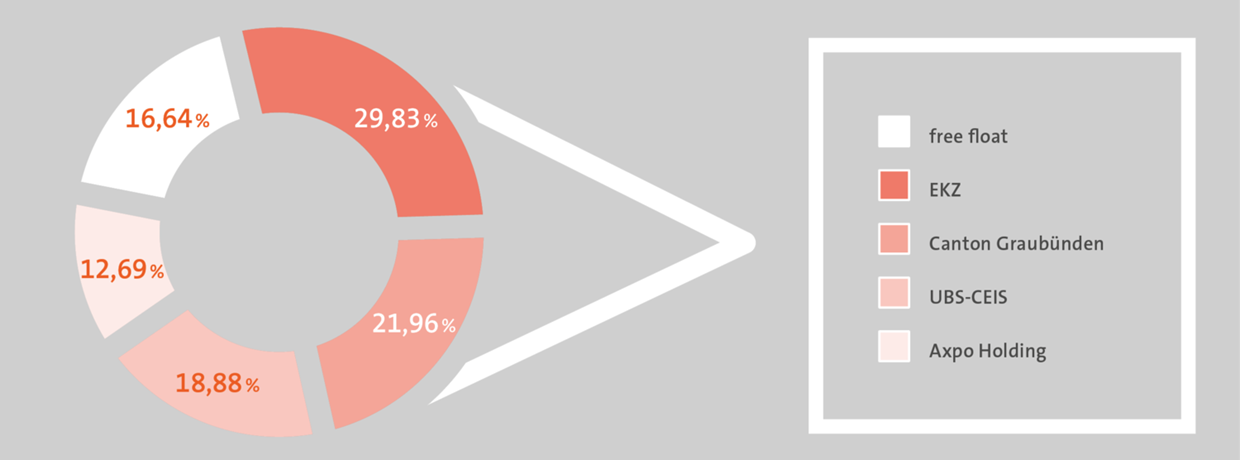
REPOWERʼS SHAREHOLDER STRUCTURE
HEADCOUNT
|
at 30 June |
2018 |
2017 |
|
|
|
|
|
Switzerland |
432 |
428 |
|
Italy |
162 |
161 |
|
Total |
594 |
589 |
|
|
|
|
|
Trainees |
30 |
30 |
|
Sales consultants Italy |
600 |
606 |